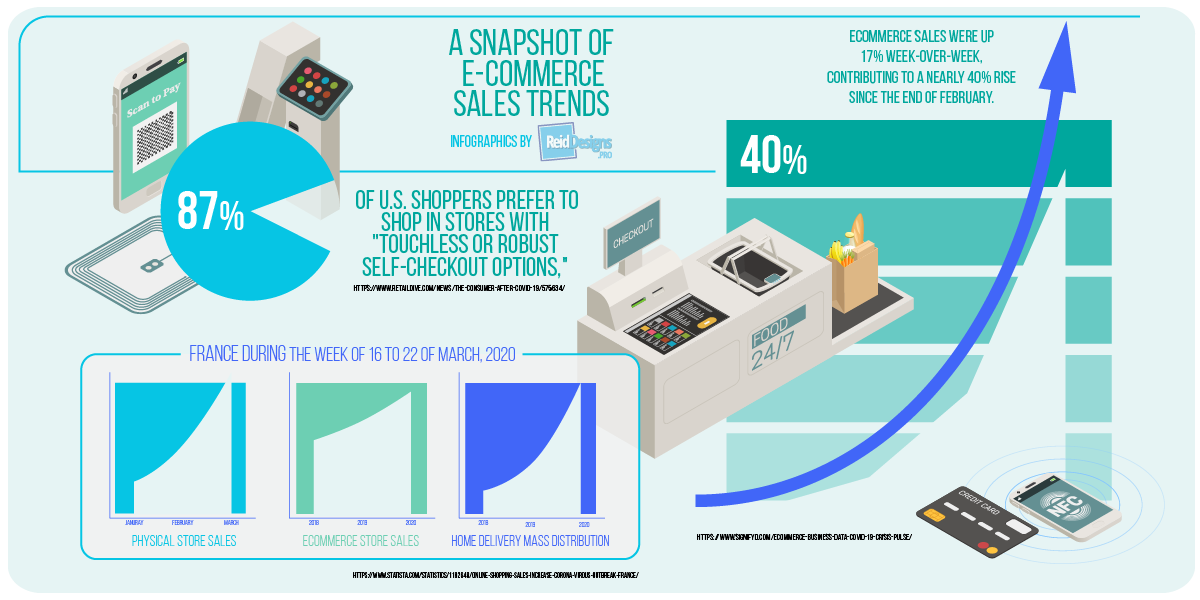
Some stats on e-commerce during Covid-19 infographics
In doing research for my blog post on why it’s important to start working on your online business here. I amassed a lot of stats and figures of consumer behaviour for the last few months during the outbreak of Covid 19. There is no doubt the Corona Virus is a game changer. It’s forcing people out of their comfort zones. People who prefered to go to the grocery now have to learn to order online. Those who used to expect delivery in a day now have to wait longer. New ways of purchasing and delivering product will change. Procedures and plans have to adapt to what we’re calling “The new normal” if you are not at least thinking about what your plan is in the next few weeks and months, you might be in for some trouble.
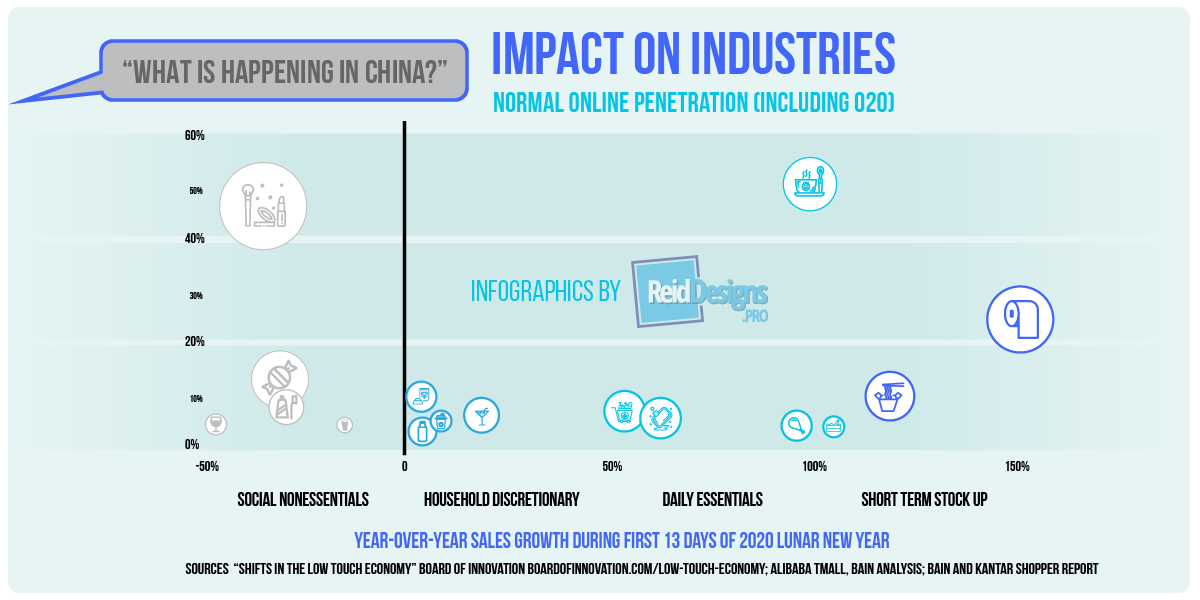
My advice is look at the trends. Right now people aren’t buying beauty products, for example, that will change. People are looking right now for things to make living at home more bearable (hence in the stats outdoor and home item sales increased.) As things stabalise and are less fluid, we might possibly see a uptick on things that are not sold well right now, for example clothes.
Don’t jump on the face mask craze though. That’s like the Tulip Mania. That’s the fad now. That will settle in the next couple of weeks. Everyone will be jumping on the cloth facemask craze. My advice wait until the market settles before jumping into that at this time. Yet I could be totally wrong. It’s still a virtual unknown how long or or how far reaching this virus is going to affect us.
Yet I thought you’d be interested in the data I found. I put it into more of an infographic style here.

Ian Reid is a graphic artist at the core and love to do graphs and charts. Using data to visualize trends and communicate information is very important. Get in touch today for all your Graphic Designs and Infographic services.